|
There are several key phases to creating an ER diagram. A comprehensive guide to help you get started.
|
The process of collecting all the required information is usually achieved through dialogues and interviews with stakeholders to determine the problem, scope, and requirements of the system being designed.There are specific methods to follow for gathering requirements, which are outlined below.
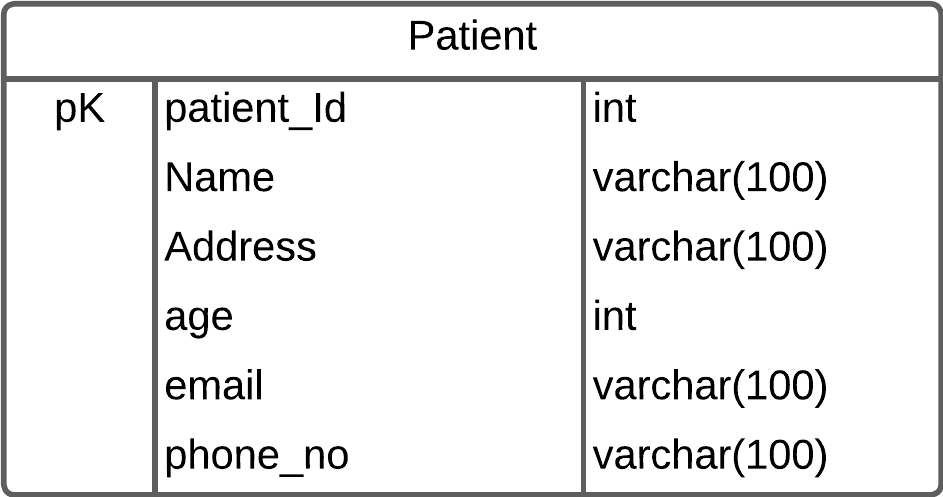
This process begins with a general idea, followed by brainstorming, and continues through to the final draft, which is a crucial action. Entities are the main components and primary objects that help specify the system. Generally, entities are considered nouns. For example, In a hospital database entities could be Doctor, Patient, and Nurse.
Building relationships between entities in an ER diagram is essential for developing a comprehensive, efficient, and reliable database system. This process ensures data integrity, simplifies complex data relationships, enhances data analysis, Supporting Complex Queries, reduces redundancy and enhances overall database functionality.
A doctor prescribes medication for the patient..

Determine attributes: Identify the characteristics of an entity and define them clearly, ensuring that the details of each attribute are associated with the object.

The cardinality of relationships describes the numerical relationship between entities. one-to-one, one-to-many, and many-tomany
Symbols on the relationship lines demonstrate the type of relationship:
The ER diagram can be created once the system entities are finalized, entity attributions are established, and entity relationships are determined.Now, demonstrate the required system diagram using a diagramming tool such as Microsoft Visio, Lucidchart, or even pen and paper. Entities are represented by rectangles. Attributes are represented by ovals, connected with the respective entities. Relationships are represented by diamonds, attached to the relevant entities. Indicate cardinality with symbols such as crows-feet or single lines.
The diagram needs to be reviewed and refined with stakeholders to ensure it accurately represents the system requirements.